

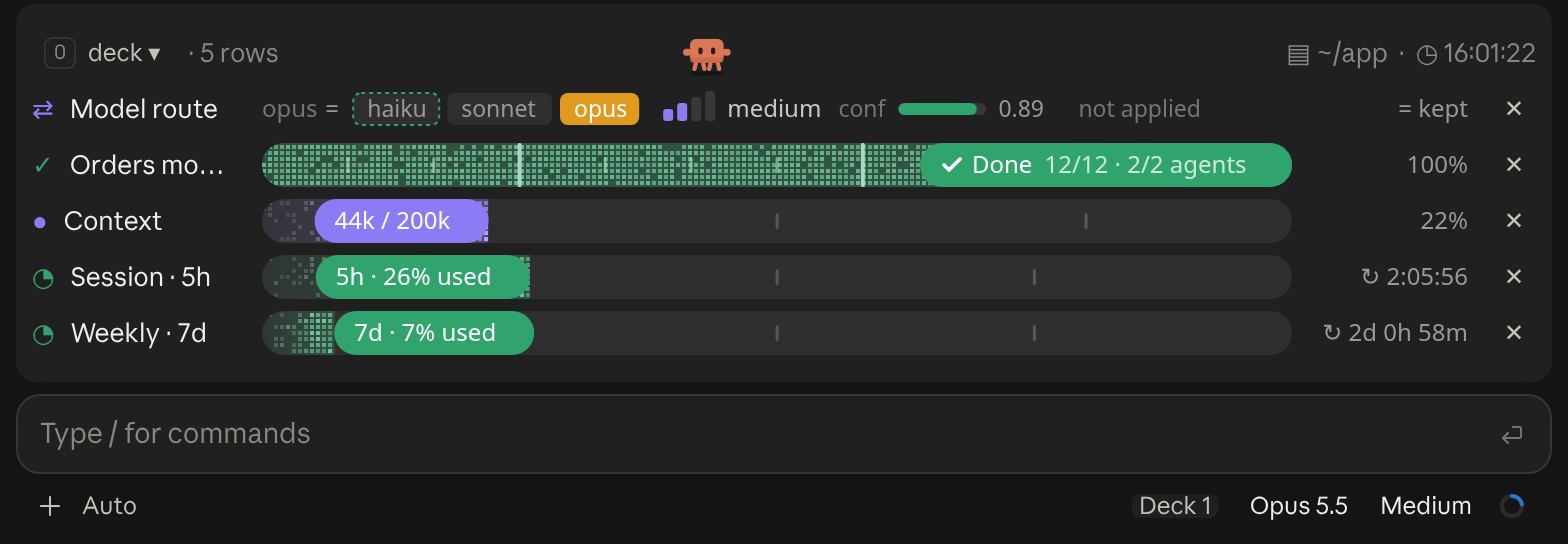
A cockpit for Claude Code: plan bars and subagent strips, context, usage limits with reset countdowns and burn rates, spend, the model route and a pet. Six bar styles, three collapsed looks. CLI and Desktop.
See where a slow Claude Code session spends time
A live pane and status entry that split agent time into model wait, tools, subagents and engine overhead, with /profile reports and OTLP traces for Jaeger or Grafana Tempo.
Terminal
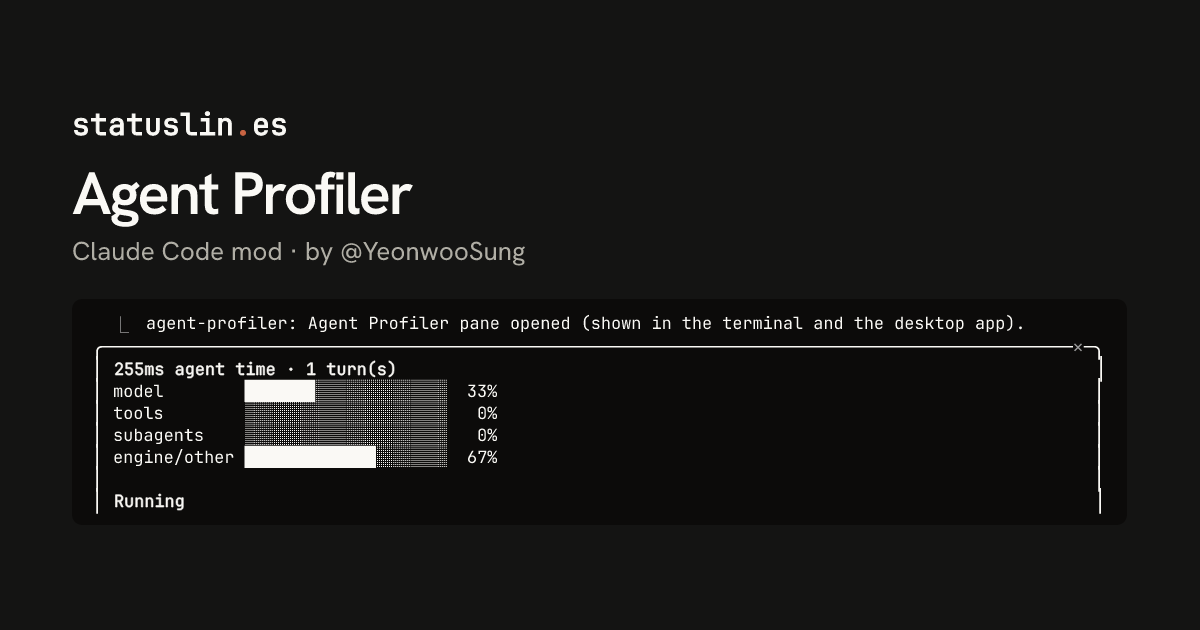
  ⎿  agent-profiler: Agent Profiler pane opened (shown in the terminal and the desktop app).
╭────────────────────────────────────────────────────────────────────────────────────────────────✕─╮
│ 255ms agent time · 1 turn(s)                                                                     │
│ model        ███████░░░░░░░░░░░░░  33%                                                           │
│ tools        ░░░░░░░░░░░░░░░░░░░░   0%                                                           │
│ subagents    ░░░░░░░░░░░░░░░░░░░░   0%                                                           │
│ engine/other █████████████░░░░░░░  67%                                                           │
│                                                                                                  │
│ Running                                                                                          │
│   idle                                                                                           │
╰──────────────────────────────────────────────────────────────────────────────────────────────────╯
  ⚠ agent-profiler: ⏱ model 33% · tools 0%
Claude Desktop
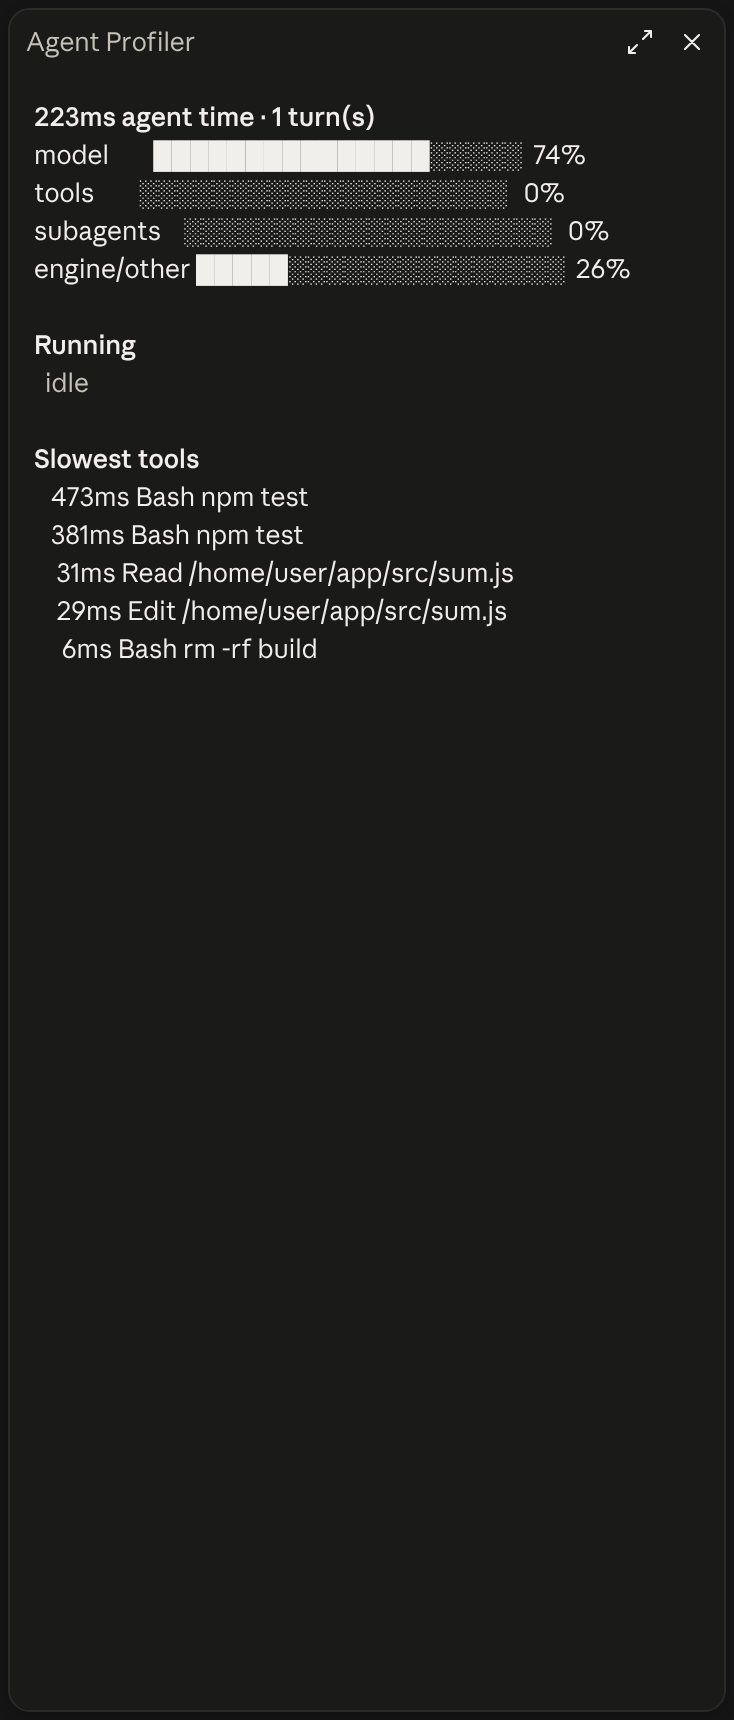
Execution profiler for Claude Code: model wait vs tools vs subagents, live, with OTLP export
This mod splits agent time into model wait, tool execution, subagents and engine overhead, so you can see which part is large. /profile prints a report for the whole session and /profile turn for the last turn, with tool and model stats, repeated file reads and findings.
Set otlpEndpoint to your collector's OTLP/HTTP base URL, such as http://localhost:4318, and the mod POSTs each trace batch to /v1/traces. Without it, the trace files in ~/.claude/agent-profiler can be sent by hand. Span names follow the GenAI conventions, like chat <model> and execute_tool <tool>.
No. It reports what the client can observe. Time to first token mixes network, queueing and prefill, and stream times are waits seen at the client, not time the model spent computing.
It still records, exports and answers /profile there, but the pane and status entry only draw in the terminal and the Desktop Code tab.
Own this listing? Add it to your README. The badge shows the install count as it grows.

[](https://staging.statuslin.es/mods/agent-profiler?utm_source=readme-badge)
Or show the preview card:
[](https://staging.statuslin.es/mods/agent-profiler?utm_source=readme-badge)
A cockpit for Claude Code: plan bars and subagent strips, context, usage limits with reset countdowns and burn rates, spend, the model route and a pet. Six bar styles, three collapsed looks. CLI and Desktop.
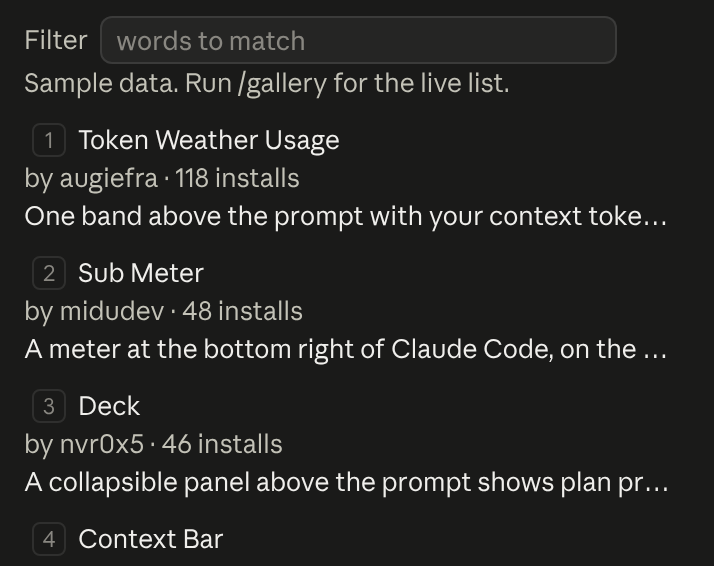
Browse the reviewed mods on statuslin.es in a pane, with their install counts and what each can reach, and put one's install prompt in your prompt box. /gallery opens it. It runs nothing: you read the prompt and send it.
                                                                                                [-]
                                                                       ▄▄▄▀▀▀▀▀▄▄▄
                                                                       ▀ ▀     ▀▀
                                                                       ▀        ▀▄
                                                                       ▀▀▀▀   ▀▀▀▀
                                                                       ▀▀▀▀▀▀▀▀▀▀▀
                                                                      ▄▀▀▀ ▀▀▀ ▀▀▄▄       Lv 5
                                                                      ▀▀ ▀▀▀ ▀▀▀▀▀▀       ●●●●○
                                                                        ▀▀     ▀▀         ♥♥♥♥♡
A pixel Pokémon that lives at the right edge of the band above the prompt
  ✧ ███████████▋     73%  🗝  Ultima Weapon  ✦ app ∙ main
  ♥ ████████████████████████ 100% 「SAVE POINT」  ✶ Limit Form  ◉ 41
Claude Code plan-usage HP bar that reads the Claude auth token to show remaining usage.
Opus 4.8 | app main | ctx 22% | ▶ Fix lease reclaim
Your in-progress Tasqr task, what the queue would hand you next with its pending count, and how much is blocked — alongside model, directory, git branch and context usage. Four styles, from a single line to a boxed panel or two-line meters.
Opus · F:15% ██▍ ▏ A:7% █▏ ▏ ⟳ 3dPer-model and all-model weekly quota meters, showing whether usage is ahead of an even pace and when the allowance resets.
✳ Usage 5h 26% · week 7% · fable 15%
Your official Claude quota: the 5-hour session, weekly, and per-model windows with reset times, read from the same endpoint as /usage rather than estimated from token logs.


